


来源:宏基因组
三元图(Ternary plot)是描述三个变量之和为常数的质心图,其核心原理是:
等边三角形内任意一点到三角形三边的距离之和等于其中一边上的高(常数);
过等边三角形内任意一点分别向三条边作平行线,按顺时针方向或逆时针方向读取平行线在各边所截取之三条线段,三条线段之和等于该等边三角形任一边之长(常数)。
在微生物组领域,我们主要利用的是基于相位网格的三元图,其特点是每一种成分在相应等边三角形的顶点的比例为100%,在其对面的线为0%,将零点线和顶点按比例划分,用以估计各成分的含量。如图1:y对面的底线代表落在底线上的所有点在y中占比为0,随着平行线逐渐靠近顶点,落在相应平行线上的点在y中的占比越来越高。
if (!requireNamespace("ggtern", quietly=T))install.packages("ggtern")
library(ggtern)
data <- data.frame(value=c(10, 30, 50, 70, 100),
x=c(90, 70, 50, 30 ,10),
y= c(10, 30, 50, 70, 90),
z=rep(0, 5))
lables <- data.frame(value=c(10, 30, 50, 70, 90),
x=rep(0.5, 5),
y=c(0.2, 0.35, 0.5, 0.65, 0.8))
p=ggtern(data,aes(x,y,z))
p=p + geom_crosshair_tern() + geom_mask() +
geom_text_viewport(x=lables$x, y=lables$y, label=lables$value, color='red') +
theme_bw()
p
# 保存位图和矢量图,分别用于预览和排版
ggsave(paste0("b1.TenaryPlot.png"), p, width=89, height=89, units="mm")
ggsave(paste0("b1.TenaryPlot.pdf"), p, width=89, height=89, units="mm")
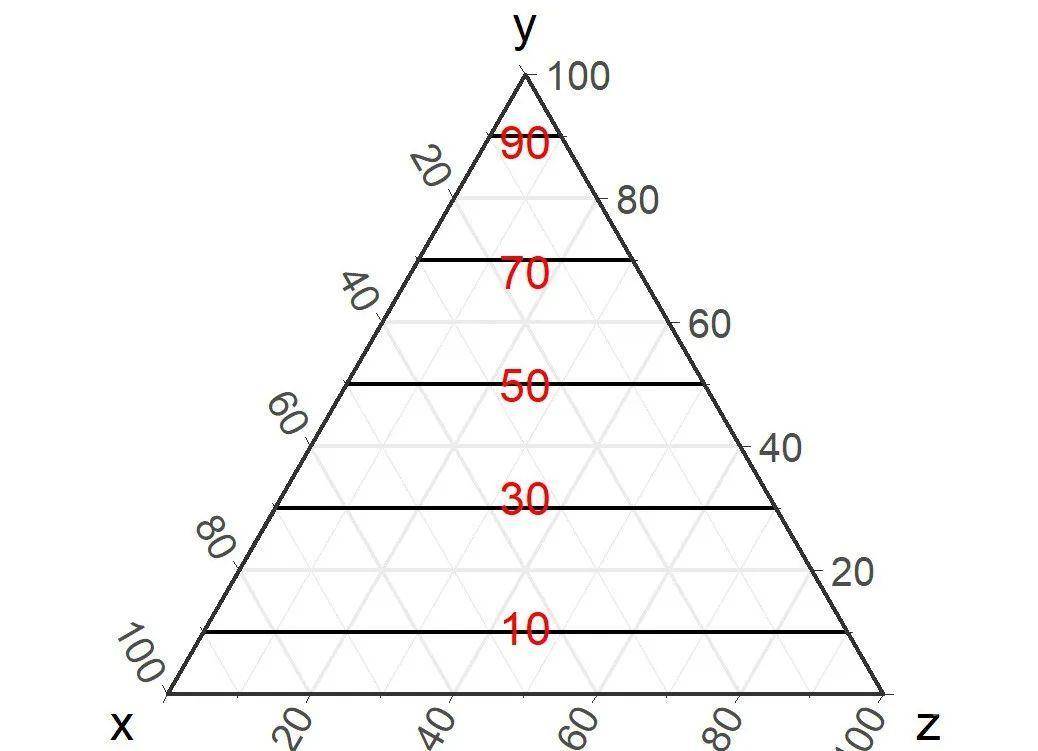
图1. 在y组中的占比逐渐增长
在解读三元图时,我们可以通过点的位置快速获得其在三个分组中的相对比例信息:目标点越靠近一角的顶点,说明他在相应的分组中比例越高;反之其相对比例就越低。根据图1,经过点的平行线在等边三角形两边的截距代表该点在对应顶点分组的占比,因此可以得出该点的在三个分组中的占比情况。如图2:过绿色点分别向三条边做平行线,然后按逆时针方向依次读取平行线在三条边的截距约为(0.33, 0.33, 0.33),因此该点在x, y, z 三个组分中的占比为0.33, 0.33, 0.33;依此原则可得出,红点占比为0.1,0.2,0.7;蓝点占比为0.2,0.7,0.1;该结果跟我们的作图代码是相符的。
data <- data.frame( x=c(0.33, 1, 2),y=c(0.33, 2, 7),
z=c(0.33, 7, 1))
p = ggtern(data, aes(x=x, y=y, z=z)) +
geom_point(size=5, alpha=0.7, color=c("green", "red", 'navy')) +
geom_mask() +
annotate(geom ='text',
x =c(0.33, 1, 2),
y =c(0.33, 2, 7),
z =c(0.33, 7, 1),
vjust=c(1.5, 1.5, 1.5),
angle=c(0, 30, 60),
label=c("(0.33, 0.33, 0.33)", "(0.1, 0.2, 0.7)", "(0.2, 0.7, 0.1)" ),
color=c("green", "red", 'navy')) +
theme_rgbw() + geom_crosshair_tern(size=1)
pggsave(paste0("b2.TenaryPlot.png"), p, width=89, height=89, units="mm")
ggsave(paste0("b2.TenaryPlot.pdf"), p, width=89, height=89, units="mm")
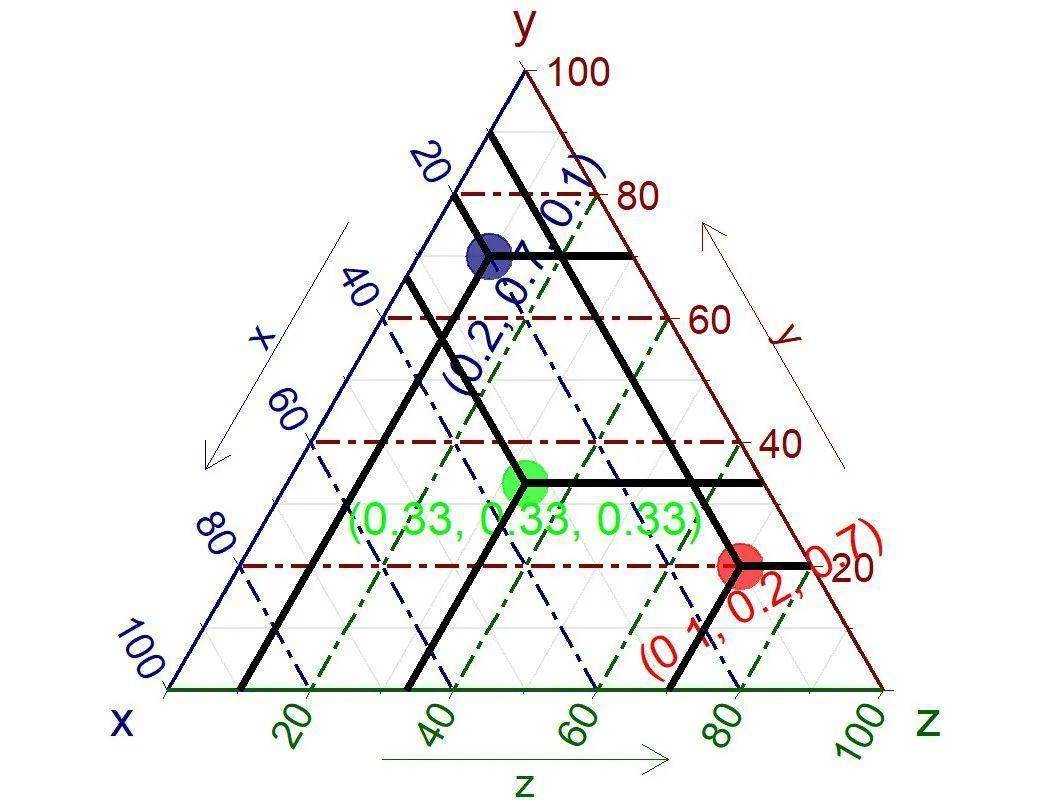
图2. 各点在x, y, z中的占比
在微生物多样性实际分析中,由于OUTs数目繁多,我们并不需要获得如此精确的占比情况。一般来说,三元图不同的点代表不同的OTUs(或其他分类水平),点的大小代表该OTUs的平均丰度(一般需要log2或log10等转换)。不仅如此,还可以对OTUs在各微环境中的丰度数据进行统计检验后,得出各OTU分别在哪种微环境中显著富集,此时三元图不仅表现出OTUs或者物种在微环境中的相对比例,还包含显著性统计结果,它打破了火山图或韦恩图两两比较的结果,总共展示了6次两两比较的结果,即每个组的富集情况是相对于其他两组的。
实例解读三元图的应用有非常大的局限性,就是必须有3个实验组。只有两组的课题就不要考虑此类图型的应用了。值得一提的是,实验设计3组也是有着最高性价比和最广泛的应用,因为2组只有1种比较组合,而3组仅成本上升50%,却有3种比较组合,结果的图表量瞬间上升为3倍,性价比极高。而3组以上组合太多,反而不利于作者把故事讲清楚,读者阅读和理解也存在一定困难。因此强烈推荐在尽量可能的情况下,设计为3组起的实验,可以有更多的分析和讨论空间,也可以应用有监督的排序分析、三元图等常用结果样式。下面分别选取来自Frontier in Microbiology、PNAS和Nature Communications杂志中近年的三元图结果进行解读和点评。
例1. 三元图门着色+堆叠柱状图本例2017年发表于自Frontiers in Microbiology文章的图4,描述了植物从三个北高寒带气候区的共同核心类群中组装特定物种的细菌群落(Kumar et al., 2017)。
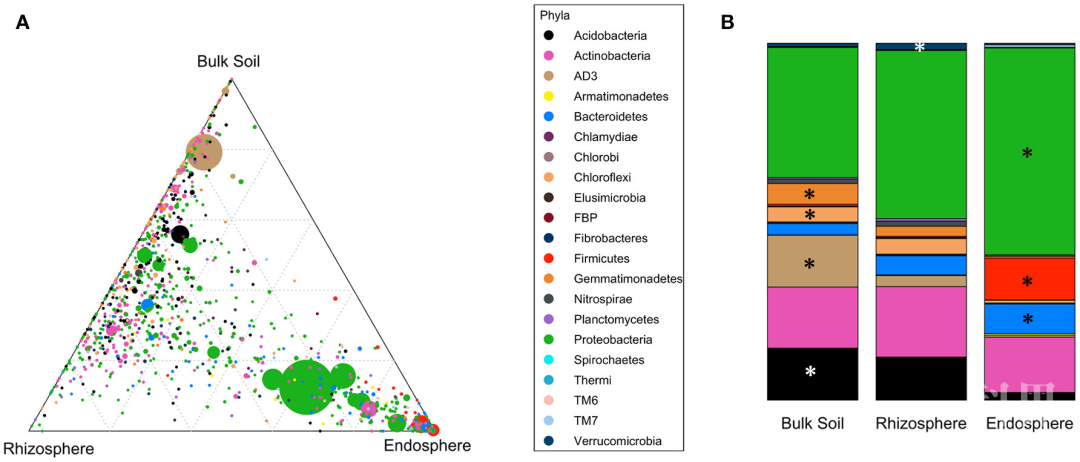
图3. 三元图展示OTUs的空间特异性
图片描述:三元图展示不同区域(土体土、根际土、根内)样本的群落结构在门水平上的差异情况,每个圆点代表一个OTU,OTU的大小、颜色和位置分别代表其相对丰度、菌门水平名称和分组情况。
Distribution of OTUs and phyla across different compartments. (A) Ternary plot of all OTUs plotted based on the compartment (Bulk soil, Rhizosphere soil, Endosphere) specificity. Each circle represents one OTU. The size, color and position of each OTU represents it relative abundance, bacterial phyla and affiliation of the OTU with different compartments, respectively.
图注描述注意事项:
总述图表展示的信息:
三元图展示OTUs在三个不同部分的空间特异性;
详细描述图片中各元素代表什么:
每个圆点代表一个OTU,OTU的大小、颜色和位置分别代表其相对丰度、菌门水平名称和分组情况。
门着色突出各门在空间的分布,同时配合堆叠柱状图展示门的相对丰度并添加显著性标记方便描述和下结论。
文中的图片解读:
主要描述了比较突出的情况,如丰度较高、规律性变化或明显聚集在某区域的门。
在门水平的不同部位中,细菌群落结构明显不同。这些差异的主要原因是由于厚壁菌门在根内相对丰度较高引起,而在土体土和根际土中它们的丰度却很低。变形杆菌和拟杆菌的相对丰度从土体土到根际土再到根内逐渐增加,同时候选门AD3、芽单胞菌门和绿弯菌门的相对减少,它们共同构成根内微生物群落丰度<4%。
Bacterial community structures were clearly different in the different compartments at the phylum level. These differences were mainly driven by strong relative enrichment of Firmicutes in the endosphere-derived sequence data sets, compared to their very low abundances in the bulk and rhizosphere soils. The relative abundances of Proteobacteria and Bacteroidetes increased progressively from bulk to rhizosphere soil to the endosphere, with a concomitant decrease in those of candidate division AD3, Gemmatimonadetes and Chloroflexi, which collectively constituted <4% of endosphere communities.
例2. 三元图展示各种特异+箱线图本例选自2016年发表于PNAS杂志上一文的图4(Zgadzaj et al., 2016),介绍了豆科模式植物百脉根的结瘤突变体中根际微生物组变化的研究。
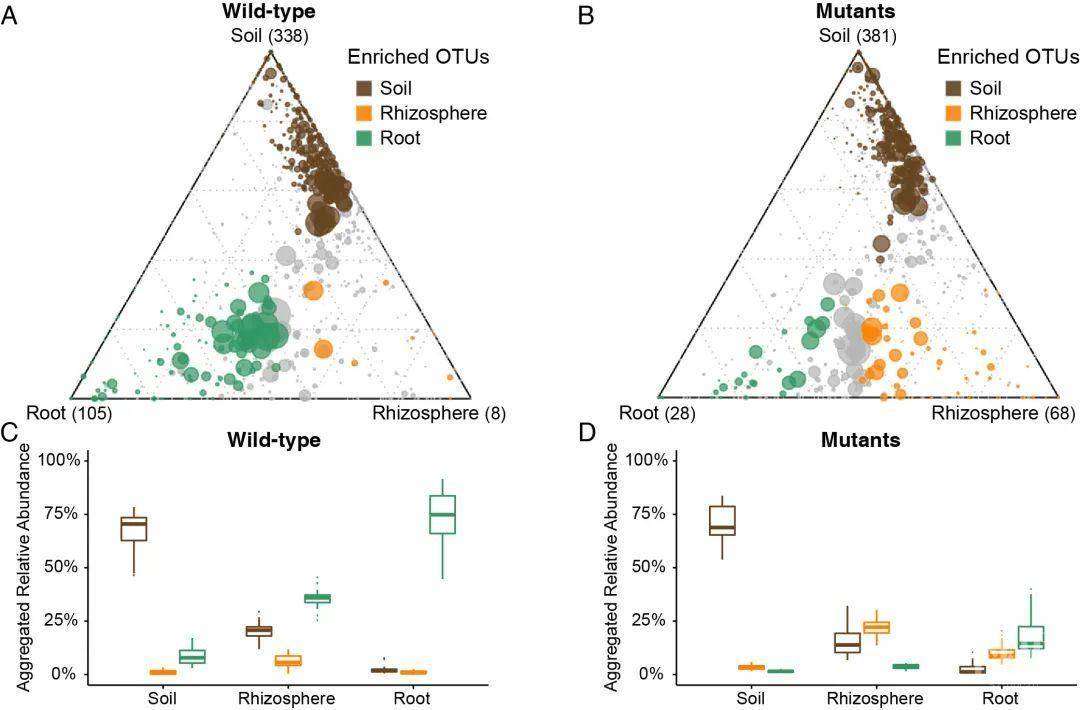
图4. 三元图展示不同取样部位中特异富集的OTUs
图片描述:
最上方的”Wild-type”和”Mutants”指明材料类型,分别为野生型和突变体;
三个顶点分别为三个取样部分,并在括号中指出显著富集的OTUs数量;
点的大小代表三组样品的平均相对丰度;
通过颜色指示显著富集情况:
土壤=土色, 根际土=橘黄色,根系=绿色,灰色=两两比较中未全部显著富集的(均未富集,只相对其中一个分组富集)。
配和箱线图,进一步突出各组特异OTUs累计丰度的组间差异变化。
Ternary plots depicting compartment RA of all OTUs (>5 ‰) for WT SampleID (A; WT; n=73) and mutant SampleID (B; nfr5-2, nfr5-3, nin-2, and lhk1-1; n=118) across three soil batches (CAS8–CAS10). Each point corresponds to an OTU. Its position represents its RA with respect to each compartment, and its size represents the average across all three compartments. Colored circles represent OTUs enriched in one compartment compared with the others (green in root, orange in rhizosphere, and brown in root SampleID). Aggregated RAs of each group of enriched OTUs (root-, rhizosphere- and soil-enriched OTUs) in each compartment for the WT SampleID (C; WT; n=73) and mutant SampleID (D; nfr5-2, nfr5-3, nin-2, lhk1-1; n=118) are shown. In each compartment, the difference from 100% RA is explained by OTUs that are not significantly enriched in a specific compartment.
总结:
该图在例1的基础上添加了组间显著性差异比较的结果,包含了6次两两比较和三次韦恩图比较的结果,信息高度概括。同时,作者还进一步结合相对丰度的箱线图突出组间差异;此外,通过使用相同的色系进行A与B图,C与D图的横向比较,突出明显的分布差异,使用两类材料微生物组不同的规律一目了然。
例3. 三元图分区+堆叠柱状图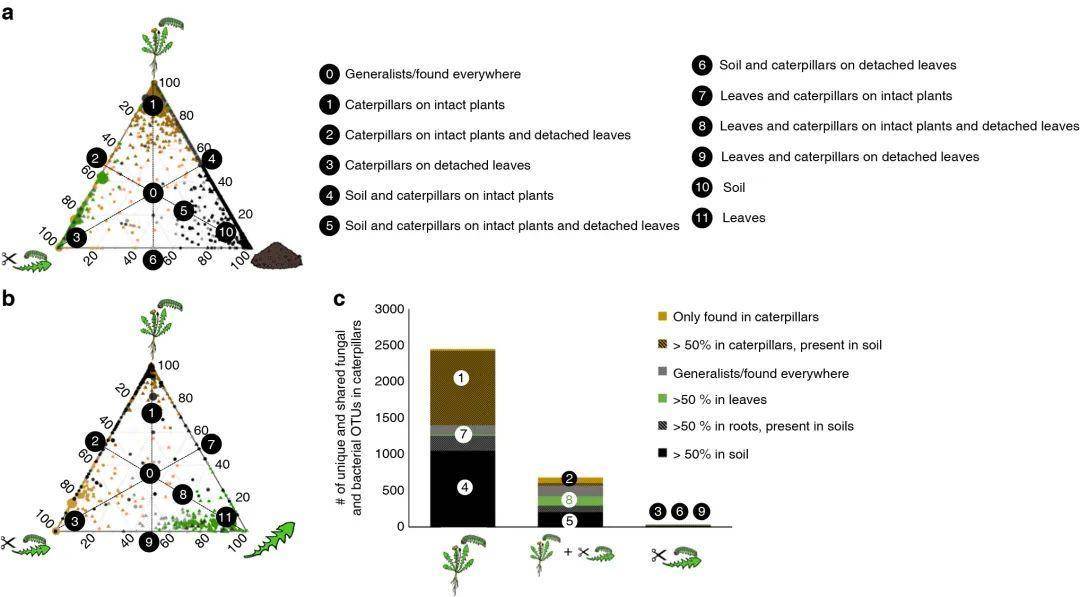
图5. 土壤、叶片和毛虫共享的微生物。
图片描述:
a. 在土壤,食用离体叶片,食用植株的毛虫中共有OTU的分布。
b. 在植物,食用离体叶片,食用植株的毛虫中共有OTU的分布。
c. 食用离体叶片毛虫和植株毛虫肠道共有和特有OTU的数量。图中颜色含义和a,b图中的一致。
a,b 三元图中符号代表一个OTU,细菌使用圆形表示,真菌使用三角形表示。使用OTU为在每组样品中出现频率超过10%的OTU。符号的大小代表了每个OTU的平均相对丰度,颜色代表该OTU主要的来源区域。绿色代表该OTU超过50%来源于叶片,棕色代表该OTU丰度超过50%来自毛虫肠道(在离体叶片上的毛虫颜色为浅棕色,在植株上生长的毛虫颜色为深棕色)。黑色代表OTU在土壤中丰度超过50%,灰色代表OTU在根系中丰度超过50%。灰色的符号代表在全部区域都存在的OTU。每个符号的位置代表该OTU出现在不同样品中的丰度比例。50%的线编号为0-9,详见图例说明具体的分区。
Fig. 2 Bacterial and fungal OTUs shared among caterpillars, plants and soil. a, b Ternary plots of OTUs found in caterpillars. Each symbol represents a single OTU; circles represent bacterial OTUs and triangles fungal OTUs. Only OTUs found in at least 10% of the samples are included in the figure. The size of each symbol represents its relative abundance (weighted average) and its color the compartment where it is primary found. Green depicts OTUs found >50% in leaves, brown depicts OTUs found >50% in caterpillars (dark brown OTUs in caterpillars on intact plants and light brown on detached leaves), black depicts OTUs found >50% in soil, grey OTUs found >50% in roots. Grey symbols represent general OTUs found in all compartments. The position of each symbol represents the contribution of the indicated compartments to the total relative abundance. The 50% lines are drawn in the figure and most important compartments are marked with numbers (0–9). a Depicts OTUs shared between soil (right side), caterpillars on intact plants (top) and caterpillars on detached leaves (left) and b depicts OTUs shared between plants (right), caterpillars on intact plants (top) and caterpillars on detached leaves (left). c The total number of unique and shared OTUs of caterpillars on intact plants and caterpillars on detached leaves. Both fungi and bacteria are included in the figure and their identity on the phylum/class level. The color of the compartment where the OTUs are predominantly found and the corresponding region in panel a and b is also shown.
结果
两种喂养方式毛虫共有的核心微生物群落也存在于植株根系(19.1%)和叶片(20.3%)中 (图2a–c),同时也有特有的微生物群,大约16.7%微生物仅仅发现在毛虫中。毛虫核心微生物群组成细菌主要有变形菌门、放线菌门和厚壁菌门,真菌为未注释的OTU。值得注意的是以完整植株为食的毛虫大部分OTU也存在与土壤中(75%)。以完整植株为食的毛虫中有超过离体叶片为食的毛虫三倍的OTU数量。
Caterpillars fed on intact plants and detached leaves shared a common core microbiome which was also present in the leaves (20.3% of their microbiome) and in the roots (19.1%) (Fig. 2a–c), but also harbored unique microbes; 16.7% of the caterpillar microbiome was found only in caterpillars. This core microbiome of caterpillars consisted predominantly of Proteobacteria, Acidobacteria, Firmicutes, and unclassified fungi (Supplementary Figs 6, 7). Remarkably, for caterpillars fed on intact plants, a large proportion of the OTUs found in caterpillars, was also detected in the soil (75%; represented as numbers 1 and 4 in Fig. 2a). Microbiomes of caterpillars fed detached leaves had virtually no additional OTUs that were not also found in caterpillars kept on intact plants (Fig. 2c), but the microbiomes of the latter contained three times more OTUs.
总结
本示例对三元图进一步划分区域,并标注编号,自定义定义各区域的分组和特点,是一种非常好的讨论方式;
各区域的顶点采用模式图的方式展示各组,可以有效的提高图片的美观和吸引力;
四组时,选择想要表达的3组,可以展示两个2-4个三元图,本文两个三元图分两次讨论,进一步增加结果的丰富性和复杂性;
结合柱状图的比较,还有之前的箱线图,都是递进表达的方式,让读者更容易理解复杂的问题,同时保持图片兼顾颜值和可读性。


 下载app
下载app